Tracking profit - not just revenue - is now essential for ecommerce businesses in 2026. With rising costs and fragmented data across platforms like Shopify, Meta, and Google, relying on outdated methods or vanity metrics like ROAS can lead to inaccurate insights. Instead, tools that consolidate data, factor in hidden costs, and focus on net profit are critical for making smarter decisions.
Here are the top tools for ecommerce profit reporting in 2026:
- Triple Whale: Ideal for Shopify users, it provides real-time profit insights and tracks customer journeys across platforms. Pricing starts at $149/month.
- Glew: Great for detailed SKU-level profitability and multi-platform integrations. Pricing ranges from $70 to $250/month.
- Daasity: Best for scaling brands needing centralized data and advanced metrics. Pricing starts at $349/month.
- Whatagraph: Simplifies reporting with AI automation and 55+ integrations. Pricing starts at $229/month.
- Google Looker Studio with Supermetrics: A DIY option for custom reports, requiring technical expertise. Starts at $29/month for Supermetrics.
Quick Comparison:
| Tool | Best For | Starting Price | Key Features | Limitations |
|---|---|---|---|---|
| Triple Whale | Shopify brands | $149/month | Real-time profit tracking, cross-platform customer journey | Shopify-only |
| Glew | Multi-platform businesses | $70/month | SKU-level analysis, 170+ integrations | Complex setup, overwhelming UI |
| Daasity | Scaling brands ($2M+ revenue) | $349/month | Data warehousing, advanced metrics | Requires technical expertise |
| Whatagraph | Automated reporting | $229/month | AI-generated reports, 55+ integrations | Costly for smaller teams |
| Looker + Supermetrics | Custom reports | $29/month | Highly customizable, cost-effective | Requires data modeling skills |
Choosing the right tool depends on your business size, complexity, and budget. Investing in the right solution can save time, improve accuracy, and help focus on profit-driving decisions.
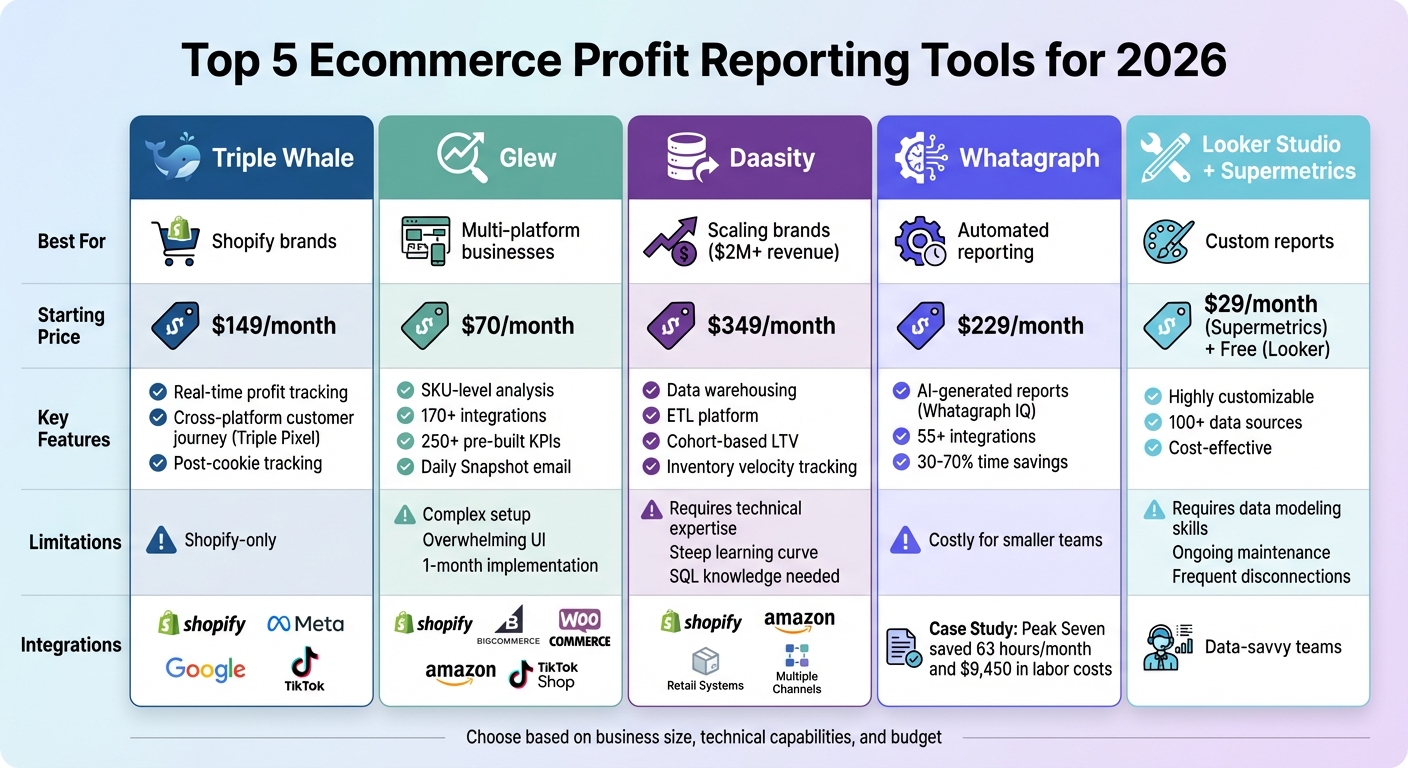
Comparison of Top 5 Ecommerce Profit Reporting Tools for 2026
How To Track Your Ecommerce Profits and Expenses | BeProfit Tracking App For Ecommerce Store Owners
sbb-itb-94eacf4
Best Ecommerce Profit Reporting Tools
Here’s a rundown of some of the top tools for tracking ecommerce profit in 2026. These platforms go beyond just revenue, helping businesses focus on net profitability - a critical metric in today’s ecommerce environment. Each tool caters to specific needs, depending on the size and complexity of your business.
Triple Whale
Triple Whale is tailored for Shopify brands and provides real-time insights into net profit by factoring in costs like goods sold, shipping, and ad spend. Its standout feature, the Triple Pixel, tracks customer journeys across platforms like Meta, Google, and TikTok - an essential capability in the post-cookie world. The dashboard gives a clear view of how much profit each marketing channel generates after all expenses.
- Pricing: Free tier available; paid plans start at $149/month (Starter) and $219/month (Advanced).
- Limitations: Exclusively designed for Shopify, so it’s not ideal for businesses operating across multiple platforms.
Glew
If you’re looking for detailed product-level and SKU-level profitability analysis, Glew is a strong choice. It connects with over 170 apps, including Shopify, BigCommerce, WooCommerce, Amazon, and TikTok Shop. With more than 250 pre-built KPIs and 30+ customer segments, it’s a robust tool for identifying which products drive profits and which drain resources. Plus, its "Daily Snapshot" email provides a quick summary of revenue, profit, and customer lifetime value every morning.
- Pricing: Free Starter plan available; Pro plans range from $70 to $250/month.
- Key Insight: Kyle Wells from Bulk Apothecary highlighted Glew’s ability to unify data views with advanced filtering.
- Drawbacks: Implementation can take up to a month, and the interface may feel overwhelming when managing multiple data sources.
Daasity

Daasity serves as both a data warehouse and an ETL platform, making it perfect for scaling brands that need to centralize data from Shopify, Amazon, retail, and more. It’s built for businesses generating over $2 million annually and often requires in-house analysts or technical expertise. The platform supports deep dives into metrics like contribution margins, cohort-based lifetime value, and inventory velocity.
- Pricing: Starts at $349/month for stores under $2 million in revenue, scaling to $999/month for those exceeding $10 million.
- Considerations: The platform has a steep learning curve, often requiring SQL knowledge or a dedicated data team to unlock its full potential.
Whatagraph

Whatagraph simplifies reporting through AI automation. Its "Whatagraph IQ" feature allows users to create comprehensive reports from simple text prompts. With over 55 native integrations - spanning ecommerce platforms like Shopify and WooCommerce, marketing channels like Meta Ads, and data warehouses like BigQuery - it’s a time-saver for busy teams.
In 2025, the agency Peak Seven reported saving 63 hours and approximately $9,450 in labor costs by automating 25 monthly reports using Whatagraph.
"Whatagraph is now our Bible - both for clients and internal teams. It's also my favorite part of the job - I'm genuinely within Whatagraph 6 out of 8 hours a day." – Kim, Peak Seven
- Pricing: $229/month (Start plan) and $579/month (Boost plan), billed annually.
- Strengths: Praised for its intuitive interface and ability to cut reporting time by 30%–70%.
Google Looker Studio with Supermetrics

This DIY solution is ideal for teams with technical expertise. Supermetrics acts as the data pipeline, pulling information from over 100 sources into Google Looker Studio, where custom visualizations can be built. It’s a cost-effective option for data-savvy teams.
- Pricing: Supermetrics starts at $29/month for a single data connection, while Looker Studio is free.
- Challenges: Requires knowledge of data modeling and ongoing maintenance. Tanja Keglić from Achtzehn Grad switched to Whatagraph in 2025, citing frequent disconnections and the time-consuming process of reconnecting sources with Supermetrics.
- Best For: Teams that need highly customized reports and have the resources to manage the setup.
Each of these tools offers unique advantages, so choosing the right one depends on your specific business needs, technical capabilities, and budget.
How to Choose the Right Profit Reporting Tool
When dealing with fragmented data, picking the right profit reporting tool is crucial. It should align with your business size, integrate seamlessly with your systems, and deliver clear value for your investment.
Business Size and Sales Volume
Your business stage heavily influences the type of tool you need. For solopreneurs or early-stage businesses earning less than $500,000 annually, simplicity and affordability are key. Tools like Wave or basic Shopify Analytics are great for keeping track of income and expenses without overwhelming complexity.
As your business grows - particularly for brands generating seven to eight figures - it’s time to shift focus from revenue tracking to profit analysis. This means investing in tools that offer detailed insights, such as SKU-level margins, lifetime value by customer cohorts, and payback periods for acquisition costs. For example, some growing brands have increased net sales by over 75% by using dashboards that pinpoint their most profitable markets.
For enterprise-level operations earning eight to nine figures, the demands grow exponentially. Managing multiple sales channels like Amazon, Walmart, and retail systems requires advanced tools with robust data infrastructure. Solutions like Daasity or Improvado provide advanced data warehousing and SQL access for custom modeling. A case in point: ASUS, a global electronics brand, used Improvado to centralize its marketing data into a managed BigQuery instance, saving roughly 90 hours per week that were previously spent standardizing reports across global locations. Each stage of growth calls for tools that match the complexity of operations while delivering actionable insights.
Integration and Compatibility
Once you’ve identified tools that suit your business size, the next step is ensuring they integrate seamlessly with your existing systems. Native integrations are a must. Before committing to a tool, confirm it can connect directly to your tech stack, whether that’s Shopify, TikTok Ads, Recharge for subscriptions, or ShipStation for logistics. Native integrations simplify setup and ensure smoother data flow compared to manual CSV uploads or custom API solutions.
Platform compatibility is another critical factor. Some tools, like Triple Whale, TrueProfit, and Polar Analytics, only work with Shopify, making them unsuitable for businesses using WooCommerce or BigCommerce. For companies selling across multiple platforms, tools like Glew or Daasity can consolidate data from various channels into one unified dashboard.
Integration should also extend to accounting software like QuickBooks or Xero, as well as fulfillment partners. This ensures that profit calculations account for all costs, including fees, shipping, and cost of goods sold. For example, Achtzehn Grad, a performance marketing agency, switched from Looker Studio with Supermetrics to Whatagraph after experiencing frequent connection issues and a five-source data blending limit. The switch saved them over five hours per report by improving data stability and loading speeds. Proper integration eliminates data silos and ensures your profit reporting is both accurate and reliable.
Budget and ROI
Profit reporting tools vary widely in price. Entry-level options like basic Shopify Analytics can be free, while enterprise-grade solutions might cost $999 or more per month. For most businesses, costs typically fall into these ranges:
- Entry-level tools: $9 to $35 per month
- Mid-market solutions: $70 to $229 per month
- Advanced tools for scaling brands: $349+ per month, depending on revenue and data needs
The real value lies not just in the price but in the time savings and improved decision-making these tools enable. For instance, marketing agency Peak Seven automated 25 monthly reports using Whatagraph, cutting preparation time from four hours to just 1.5 hours per report. This saved them 63 hours per month, equating to about $9,450 in billable time. Similarly, Webgility users have seen order volume grow by an average of 651% after one year of using integrated reporting tools.
When evaluating tools, ask questions like: "Which SKUs are losing margin?" or "Is extra ad spend delivering returns?" If you have a data-savvy team, customizable stacks like Looker Studio with Supermetrics might be a good fit. Otherwise, plug-and-play solutions can simplify reporting without requiring technical expertise. Choosing a scalable tool now can save you from expensive transitions in the future, ensuring your reporting evolves alongside your business.
Conclusion
Choosing the right profit reporting tool is crucial for staying ahead in the competitive ecommerce world of 2026. As StoreHero aptly states, "Scaling without a clear handle on profit has become a dangerous game". The right tool not only highlights blind spots but also transforms scattered data into actionable insights that drive smarter decisions.
The tools discussed - Triple Whale, Glew, Daasity, Whatagraph, and Google Looker Studio with Supermetrics - cater to different business needs. For Shopify-first brands, Triple Whale offers an easy-to-implement solution, while omnichannel businesses can benefit from Daasity's advanced data warehousing capabilities. Success lies in finding a tool that aligns with your business size, integrates seamlessly with your tech stack, and focuses on net profit after all costs, steering clear of vanity metrics like revenue or ROAS.
Businesses that embrace automated reporting tools experience real results. For example, companies report an average 651% increase in order volume within a year, and agencies such as Peak Seven have saved 63 hours per month by switching to automated platforms. These time savings translate directly into opportunities for strategic growth and innovation.
FAQs
What costs should I include to calculate true net profit?
To figure out your true net profit, you need to include all the expenses that come with running your business. This means factoring in operating costs, taxes, employee salaries, rent, marketing expenses, shipping fees, and any other costs tied to your operations. The key is to account for every relevant expense so you can calculate an accurate profit number.
Which tool fits my store size and monthly budget?
The best ecommerce profit reporting tool for your business will depend on your store's size and budget. For smaller businesses, Shopify’s built-in reports or Google Analytics offer affordable ways to gain insights. If your store is expanding, tools like Webgility or StoreHero provide more advanced analytics to support growth. Larger businesses with bigger budgets might find platforms like Daasity or Power BI better suited for handling complex reporting and scaling needs. Pick the tool that aligns with your current requirements and future growth plans.
How hard is it to set up profit reporting across all my channels?
Setting up profit reporting for ecommerce channels largely hinges on the tools and integrations you decide to use. These days, many platforms consolidate data from sources like Shopify, Amazon, and even social media into a single, easy-to-navigate dashboard. While the initial setup might take some time - linking systems and fine-tuning settings - most modern tools are designed with user-friendly interfaces and automation. This means once everything is up and running, tracking your profitability becomes a smooth process with minimal effort required on your part.