When your CMS-based website loads, every HTTP request adds time and resource strain. Too many requests can slow down your site, hurt user experience, and even impact search rankings. Here’s what you need to know:
- Fewer Requests = Faster Load Times: Aim for under 50 requests per page, ideally 25 or less.
- Key Strategies:
- Minify and Combine Files: Shrink CSS/JS/HTML and merge files to reduce request counts.
- Use CDNs: Deliver content faster by caching assets closer to users.
- Optimize Critical Resources: Prioritize loading essential CSS/JS while deferring non-critical ones.
- Compress API Responses: Use Gzip or Brotli to cut response sizes by up to 90%.
- Audit and Eliminate Redundant Requests: Remove unnecessary plugins, scripts, and advanced web building tools that are no longer needed.
Reducing HTTP requests not only speeds up your site but also improves metrics like LCP and TTFB, lowers bounce rates, and enhances user satisfaction. Let’s dive into the details.
HTTP Request Optimization Impact on Website Performance and User Behavior
Reducing HTTP Requests: Effective Techniques to Speed Up Your Website
sbb-itb-94eacf4
Reducing and Combining Resources
Improving your CMS's performance starts with optimizing CSS, JavaScript, and HTML files. By reducing the number and size of HTTP requests, you can significantly boost load times and overall site efficiency. For instance, platforms like WordPress and Drupal often load numerous files from themes and plugins by default, which can create a cascade of requests that slows down performance.
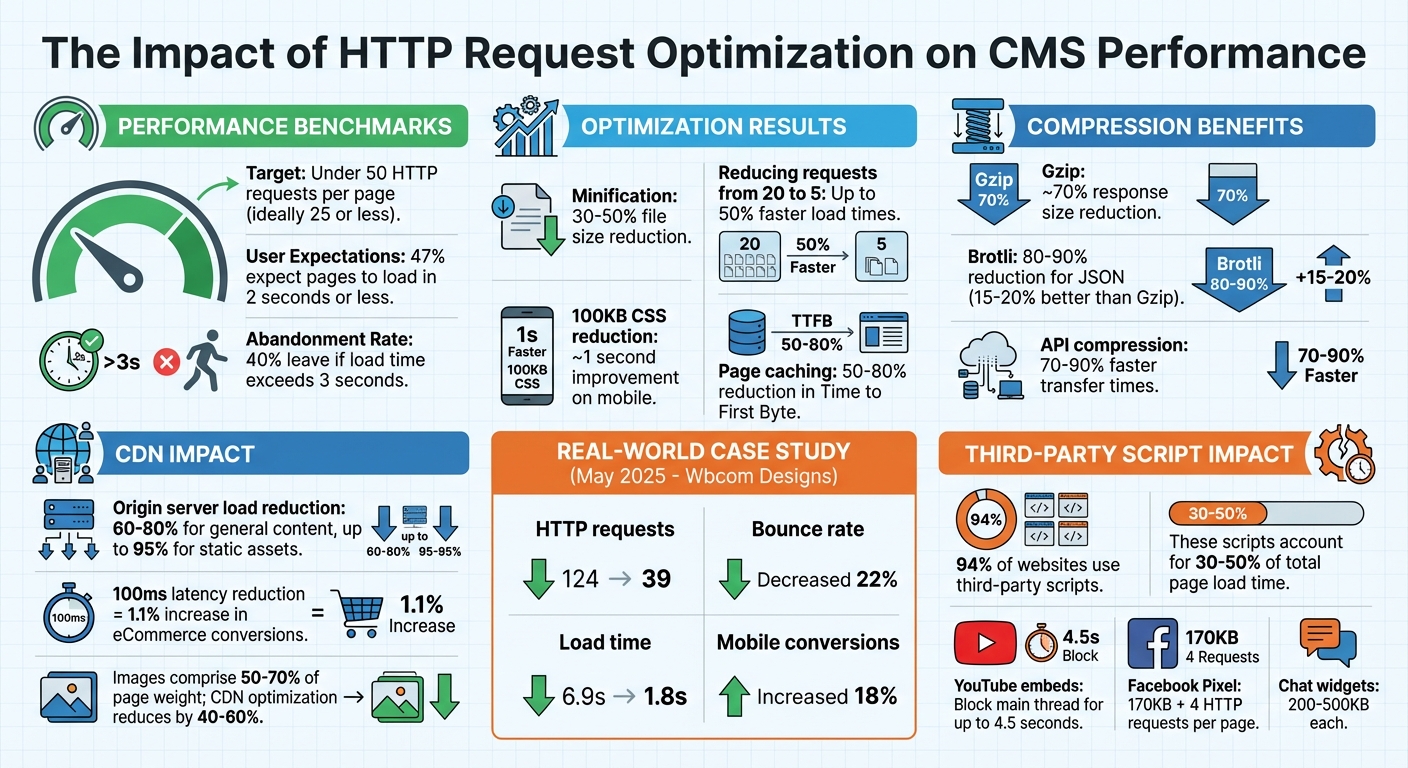
Minification is a great way to tackle this - removing unnecessary characters like whitespace, comments, and line breaks can shrink file sizes by 30% to 50% without affecting functionality. Pair this with bundling, which merges multiple files into one, and you address both file size and request count. For example, cutting HTTP requests from 20 to 5 can reduce load times by up to 50%, while trimming 100KB from CSS files can improve mobile load speeds by about 1 second.
Minify and Compress Files
Tools like Webpack, Gulp, or CMS plugins can automate minification. WordPress users can rely on plugins like Autoptimize or WP Rocket, while Drupal users can turn to the Advanced Aggregation module. Once files are minified, compress them further using GZIP or Brotli to maximize size reductions.
To go a step further, use Chrome DevTools' Coverage tab to identify and remove unused code. Often, 55% to 65% of a stylesheet's size consists of unused code that can be eliminated before minification.
Combine Multiple Files
Bundling CSS and JavaScript into single files can cut down on HTTP requests, which is especially helpful for CMS platforms loaded with multiple themes and plugins. However, maintaining the original loading order is critical - disrupting it can cause layout issues or break functionality. Modern tools can automate bundling while preserving dependencies.
Here’s a quick guide to bundling based on your setup:
| Scenario | Bundle? | Rationale |
|---|---|---|
| HTTP/1.1 Protocol | Yes | Reduces connection blocking and waterfall effects |
| HTTP/2 or HTTP/3 | Not always | Multiplexing handles multiple requests efficiently; separate files may improve caching |
| Frequent updates | No | Large bundles may force users to re-download unchanged code due to cache invalidation |
While HTTP/2 and HTTP/3 can handle multiple small files better than HTTP/1.1, the choice to bundle depends on your server, network, and caching setup. As Jelena Janić, Product Manager at WP-Optimize, explains:
"On modern HTTP/2 and HTTP/3 setups, multiple small files no longer carry the same penalty they did under HTTP/1.1".
Testing configurations with tools like GTmetrix or PageSpeed Insights can help you find the best approach for your site.
Once files are bundled, focus on prioritizing critical resources to further improve performance.
Load Critical Resources First
After consolidating files, the next step is optimizing the load order of essential assets. Browsers pause rendering when they encounter CSS or JavaScript in the <head> section until those resources are fully downloaded. To speed things up, prioritize critical resources - those needed to display content visible in the initial viewport - and load non-critical assets later.
One effective technique is inlining above-the-fold CSS directly into a <style> block within your HTML. This eliminates the need for an extra HTTP request. For non-critical CSS, you can use a media swap:
<link rel="stylesheet" href="..." media="print" onload="this.media='all'">
This approach loads the stylesheet asynchronously without delaying rendering. Similarly, applying the defer attribute to most JavaScript files ensures they download alongside HTML parsing but execute only after the DOM is fully loaded. Use the async attribute for scripts that don’t depend on other resources, such as analytics.
Implementing critical CSS can improve the Largest Contentful Paint by 200ms to 500ms. Since TCP connections transfer only about 14KB in the first round trip due to slow-start mechanisms, keeping your critical HTML and CSS within this limit allows the page to begin rendering after a single network round trip - dramatically improving perceived performance.
Using a Content Delivery Network (CDN)
Reducing HTTP requests isn’t just about optimizing files - it’s also about how you deliver those files. That’s where a Content Delivery Network (CDN) comes in. By distributing content through a CDN, you can cut down on latency and reduce the load on your origin server. Essentially, a CDN brings your content closer to your users, ensuring faster and more reliable delivery.
A CDN works by caching your resources on servers located around the globe. These edge servers take the pressure off your origin server, potentially reducing its load by 60% to 80% for general content and up to 95% for static assets. This efficiency matters: a 100ms reduction in latency can increase eCommerce conversion rates by 1.1%, and when page load times stretch from 1 to 3 seconds, bounce rates can spike by 32%. CDNs address these issues by handling TCP and TLS connections at nearby edge servers, eliminating the need for long, costly round trips to your origin server.
How CDNs Work
CDNs rely on edge servers to quickly serve cached resources. When a user requests something, the CDN routes the request to the closest edge location. If the edge server has the resource cached, it delivers it immediately, cutting response times from 200ms to as little as 20ms.
Modern CDNs also use origin shielding, which adds an intermediary cache between edge servers and your origin server. If an edge server doesn’t have the requested resource, it checks the shield first instead of going directly to your origin. This setup prevents multiple edge servers from overwhelming your origin with simultaneous requests for the same uncached resource.
CDNs also support advanced protocols like HTTP/2 and HTTP/3, which allow for multiplexing to speed up resource delivery. When paired with TLS 1.3, which reduces handshake times by 33%, these technologies significantly enhance performance.
To make the most of these benefits, setting up proper cache-control headers is critical.
Setting Up Cache-Control Headers
Cache-Control headers are essential for telling both CDNs and browsers how long to store resources. Without a caching strategy, a CDN is just an expensive middleman.
- Use the
s-maxagedirective to set different cache durations for CDNs and browsers. For example, you could cache HTML at the edge for 5 minutes (s-maxage=300) while forcing browsers to revalidate immediately (max-age=0). - Static assets with content hashes in their filenames (like
style.a1b2c3.css) should useCache-Control: public, max-age=31536000, immutable. This directive prevents unnecessary revalidation. Facebook found that 20% of their static assets were being needlessly revalidated before implementing this approach. - For non-fingerprinted images, a 30-day cache (
max-age=2592000) balances freshness with performance. - The
stale-while-revalidatedirective allows cached content to be served immediately while fetching updates in the background. This keeps users moving without delays.
Additionally, configure your CDN to normalize query parameters. This ensures that URLs like /page?a=1&b=2 and /page?b=2&a=1 are treated as the same cache entry.
| Content Type | Recommended Cache-Control Header |
|---|---|
| Static Assets (JS, CSS) | public, max-age=31536000, immutable |
| Images | public, max-age=2592000 |
| HTML Pages | public, max-age=300, stale-while-revalidate=60 |
| Public API Responses | public, s-maxage=60, max-age=0 |
| Private/Auth Data | private, no-store |
With proper caching rules, you can maximize the efficiency of your CDN and ensure smooth delivery of static assets.
Serving Static Assets Through CDNs
Static assets like images, CSS, JavaScript, and fonts are the backbone of your website’s performance. Images alone can make up 50% to 70% of a page’s total weight. Offloading these to a CDN with automatic optimization can reduce their size by 40% to 60%. Many CDNs provide edge-based image transformation, converting formats like JPEG to WebP or AVIF based on browser support.
For best results, serve all static assets - CSS, JavaScript, fonts, videos, and PDFs - through your CDN. If you use a separate subdomain like static.example.com, make sure to configure CORS headers (Access-Control-Allow-Origin) to avoid browser issues with fonts and scripts.
CDN pricing varies widely. BlazingCDN starts at $0.004 per GB (around $400 for 100 TB monthly). Cloudflare offers a generous free tier, while AWS CloudFront provides 1 TB of free data transfer for the first 12 months. Bunny CDN starts at about $1 per month, and Fastly’s plans begin at roughly $50 per month.
To get the most from your CDN, aim for a cache hit ratio of 90% or higher. Regularly check your CDN analytics to identify resources that aren’t caching properly and fine-tune your Cache-Control headers as needed.
Compressing API Responses
CMS platforms often deal with hefty API responses, especially when using formats like JSON or XML. Compressing these responses before sending them can cut transfer times by a massive 70% to 90%, resulting in faster, more responsive interfaces. Here’s a closer look at how to implement compression effectively.
Compression works through a simple back-and-forth between the client and server. The client sends an Accept-Encoding header (e.g., gzip, br), signaling the compression methods it supports. The server then picks a method and includes a Content-Encoding header in its response.
Using Gzip and Brotli Compression
Gzip has been a reliable compression standard for years, leveraging the DEFLATE algorithm. It typically reduces text-based responses by about 70%, making it a favorite for high-traffic APIs thanks to its low CPU usage.
Brotli, created by Google, takes things a step further, compressing files 15–20% more efficiently than Gzip. For JSON responses, it often achieves reductions of 80–90%. While Brotli demands more CPU resources during compression, modern servers handle this trade-off with ease.
For example, an e-commerce platform reduced a file size from 2.5 MB to just 380 KB using Gzip, slashing load times from 1.2 seconds to 0.3 seconds.
To enable compression, configure your web server (like Nginx or Apache) instead of handling it directly in your application. Focus on compressing text-based MIME types such as application/json, application/xml, and text/html. Avoid compressing formats already optimized for size, like JPEG, PNG, or PDF.
Set a minimum threshold of 1 KB (1,024 bytes) before applying compression, as compressing very small payloads can add unnecessary overhead. For instance, Cloudflare sets a minimum of 48 bytes for Gzip and 50 bytes for Brotli. Always include the Vary: Accept-Encoding header in your responses to ensure CDNs and caches store separate versions tailored to different compression methods.
| Algorithm | Compression Ratio | CPU Usage | Browser Support | Best Use Case |
|---|---|---|---|---|
| Gzip | ~70% reduction | Low | Universal | High-traffic APIs, legacy systems |
| Brotli | 15–20% better than Gzip | Moderate to High | Modern browsers (2016+) | Content-heavy APIs, modern web apps |
Reducing Payload Size
Compression is just one piece of the puzzle. You can further optimize performance by sending only the data that’s truly necessary. Using sparse fieldsets, for example, allows clients to request only specific fields. A call like GET /api/users?fields=id,name returns just the id and name fields, skipping unnecessary metadata.
For large datasets, cursor-based pagination helps keep response sizes manageable and performance steady. When dealing with massive datasets, using streaming responses - like Newline-delimited JSON (NDJSON) - enables clients to start processing data as it arrives, rather than waiting for the entire payload.
"Compression, streaming, and intelligent field selection turn bloated APIs into snappy experiences." - Sanjeev Sharma, Full Stack Engineer
Compressing a 500 KB JSON response to just 50 KB can cut transfer times by 90%, offering a noticeable boost in mobile performance.
However, keep in mind that compression isn’t without risks. BREACH attacks, for instance, exploit size variations in HTTPS responses to extract sensitive information. To mitigate this, disable compression for endpoints that mix user-controlled input with sensitive data, such as API keys or CSRF tokens.
Improving Database Queries and Data Fetching
Optimizing backend processes, particularly database queries, plays a key role in reducing HTTP requests and improving CMS performance. Poorly designed queries and unnecessary data fetching can overwhelm servers, leading to slower response times.
Optimizing Database Queries
Using tools like MySQL's EXPLAIN can help pinpoint issues such as inefficient queries, missing indexes, or excessive row scans. For example, in a database with 700,000 posts, an unoptimized query might require a resource-heavy "filesort" operation. Adding a simple date constraint could reduce the rows processed from 677,527 to just 5,825 - a dramatic improvement.
If you're using WordPress, disabling SQL_CALC_FOUND_ROWS in WP_Query can prevent performance degradation, especially on sites with large datasets. By default, WordPress enables this feature, even when pagination isn't required. To bypass it, set the no_found_rows argument to true in WP_Query. Alternatively, you can replace SQL_CALC_FOUND_ROWS with a more efficient COUNT(*) query using the found_posts_query or found_users_query filters.
Duplicate queries are another common issue. Instead of repeatedly calling functions like $my_query->get_posts(), access properties directly using $my_query->posts. This avoids triggering additional database queries. To keep your database lean, limit post revisions by adding define('WP_POST_REVISIONS', 5); to your wp-config.php file. This ensures only the last five revisions of a post are stored.
Fetching Only Required Data
Fetching more data than necessary increases load times and server strain. Avoid using SELECT * in your queries; instead, specify the exact columns you need to minimize response size.
GraphQL is particularly effective for nested data structures, as it allows clients to request only the specific fields they need. This avoids the over-fetching issue often seen with REST APIs.
"A large part of good GraphQL API design means ensuring that its consumers can fetch data in the most efficient way possible".
For instance, when querying blog posts with comments and authors, increasing the number of items from 2 to 20 could cause internal requests to jump from 15 to 71 without proper batching. Tools like DataLoader can resolve this "N+1 problem" by batching related requests into a single query at the resolver level. Additionally, move filtering logic directly into your database queries, and ensure frequently queried fields are indexed for faster retrieval.
| Technique | Primary Benefit | Best Use Case |
|---|---|---|
| Batching | Reduces internal N+1 requests | Nested data (e.g., Posts > Comments > Authors) |
| Persisted Queries | Minimizes HTTP payload size | Long, complex GraphQL query strings |
| Indexing | Speeds up data retrieval | Frequently filtered or sorted fields |
For large datasets, pagination ensures efficient data transfer by breaking the results into smaller, manageable chunks.
Using Pagination for Large Datasets
Transferring large datasets to frontend frameworks like React or Next.js can overwhelm browsers and lead to crashes. Pagination addresses this by limiting the amount of data sent at once, reducing payloads and latency. This keeps page load times under 3 seconds.
For datasets with over 10,000 records, cursor-based (keyset) pagination is a better choice than offset pagination. It maintains consistent speed, even as users navigate deeper into the dataset. Pagination limits should generally be set between 10 and 100 items per request.
| Feature | Offset Pagination | Cursor (Keyset) Pagination |
|---|---|---|
| Performance | Slows down on deep pages as the DB must scan and discard skipped rows | Constant speed; the DB jumps directly to the next set of data |
| Stability | Data can shift or skip if rows are deleted/added during navigation | Highly stable for real-time data |
| Best Use Case | Small datasets or random access (jumping to page 5) | Large datasets, infinite scroll, and "Load More" UIs |
To optimize pagination, ensure columns used for sorting and pagination (like created_at or id) are indexed. For cursor pagination, include a stable tie-breaker column, such as id, alongside your primary sort column to prevent shifting data when rows are added or removed.
Eliminating Unnecessary HTTP Requests
Every HTTP request adds to your page's load time, but not all requests are equally important. Over 94% of websites rely on third-party scripts, and these external resources can make up 30–50% of the total page load time. To streamline your CMS and improve performance, you need to identify which requests are essential and eliminate the rest. This step works alongside earlier optimizations to ensure only the most necessary requests remain.
Audit Your Website for Redundant Requests
Start by using your browser's Developer Tools (F12) in Chrome or Firefox. The Network tab will show every request your site makes, along with file sizes and load times displayed in a waterfall chart. For a deeper dive, run a Lighthouse audit and check the "Reduce the impact of third-party code" section, which highlights scripts that block the main thread.
Perform a force-reload (Ctrl+Shift+R) to bypass cached files and reveal all initial HTTP requests. Combine this with tools like WebPageTest or the Network and Performance tabs in Developer Tools to locate and analyze unnecessary HTTP requests.
If you're using WordPress or code export website builders, plugins like Asset CleanUp allow you to disable specific scripts and stylesheets on individual pages. This prevents site-wide loading of features that are only needed on certain pages. Conduct quarterly audits to remove scripts added for short-term campaigns or A/B tests.
Review Third-Party Scripts
Third-party scripts are often the biggest culprits when it comes to performance issues. For example, YouTube embeds can block the main thread for up to 4.5 seconds on 10% of mobile websites. A Facebook/Meta Pixel adds an extra 170 KB and makes four separate HTTP requests per page load. Chat widgets are particularly heavy - Zendesk downloads 500 KB of JavaScript (2.3 MB unzipped), while Drift uses between 200 and 400 KB.
To minimize the impact of these scripts, replace heavy embeds with static placeholders that load the full script only when users interact with them. This works well for video players, maps, and chat widgets. If a third-party service isn't directly improving conversions or user experience, consider removing it altogether.
You can also implement dns-prefetch and preconnect resource hints. These techniques establish early connections to third-party domains, cutting down on DNS lookup and TLS negotiation delays.
Consolidate Tracking and Analytics Scripts
The average website runs 30–40 third-party scripts, often including separate tracking pixels for platforms like Google Analytics, Facebook, LinkedIn, Twitter, and others. Each additional script increases HTTP requests and execution time. Moving tracking logic to the server side can drastically reduce client-side HTTP requests.
For example, in 2024, Instacart adopted Cloudflare Zaraz to shift their third-party tracking tools to server-side execution. By eliminating client-side scripts for over 50 tools, they reduced their Total Blocking Time from 500 ms to 0 ms and improved their Time to Interactive by 63%, cutting it from 11.8 seconds to 4.26 seconds.
Google Tag Manager (GTM) can also help by bundling multiple tracking scripts into a single container, reducing the number of initial requests. Review your GTM setup quarterly to remove unused tags and optimize triggers. Adjust triggers from "All Pages" to "Window Loaded" or set them to fire after a short delay, ensuring that primary content loads first. Alternatively, consider using a Customer Data Platform like Segment. These platforms collect data once and distribute it to multiple destinations server-side, eliminating the need for individual client-side scripts. This approach aligns with broader efforts to improve CMS performance by reducing unnecessary client-side requests.
Conclusion
Nearly half of users - 47%, to be exact - expect a webpage to load in 2 seconds or less. Meanwhile, 40% of visitors will leave a site if it takes more than 3 seconds to load. These numbers highlight the critical role speed plays in user retention.
Start with impactful changes. Enable page caching to cut Time to First Byte by 50–80%, convert images to modern formats like WebP or AVIF, and implement lazy loading for content below the fold. Essential tools like browser Developer Tools or Google PageSpeed Insights can help you assess your current performance. Aim for fewer than 50 HTTP requests per page - this standard is key to achieving faster load times. These steps not only improve speed but also directly enhance user engagement and revenue.
"Speed is not just a technical win, it's a strategic advantage." – WPBeginner
These strategies aren't just theoretical - they deliver real results. For instance, in May 2025, Wbcom Designs optimized a WordPress site by reducing HTTP requests from 124 to 39 through theme adjustments, plugin removal, and a CDN. The outcome? Load times dropped from 6.9 seconds to 1.8 seconds, bounce rates decreased by 22%, and mobile conversions rose by 18%. This case underscores how applying these techniques can lead to measurable success.
FAQs
How can I identify which HTTP requests slow down my CMS the most?
To spot slow HTTP requests in your CMS, start by analyzing server logs or leveraging performance monitoring tools. For instance, checking Apache access logs can show response times for individual requests. You can also use log analysis scripts to identify sluggish URLs that have a high volume of requests. Furthermore, performance monitoring tools are great for uncovering bottlenecks. Reducing the number of HTTP requests through optimization techniques can also help boost speed.
Should I bundle CSS/JS if my site uses HTTP/2 or HTTP/3?
With HTTP/2 or HTTP/3, bundling CSS and JavaScript files isn't as important as it used to be. Thanks to multiplexing, these protocols let multiple files load at the same time. This means you can keep your files separate, which can actually boost caching and parallel downloads. The result? A more efficient website.
When should I avoid Gzip/Brotli on API responses?
When dealing with API responses, it's best to skip using Gzip or Brotli if the content is already compressed - like images, videos, or fonts. Similarly, avoid compression for responses that are very small, typically under 1KB. In such cases, compression can introduce unnecessary overhead and might even make the response slightly larger.