Want to ensure your CDN delivers speed and reliability? Monitoring its performance is the key. A CDN distributes your website's files globally, but without proper tracking, you might face slow load times, user drop-offs, and revenue loss. Here's what you need to know:
- Key Metrics to Track: Cache Hit Ratio (CHR), Time to First Byte (TTFB), and error rates.
- Monitoring Methods:
- Synthetic Testing: Simulated tests to detect issues before they impact users.
- Real User Monitoring (RUM): Collects data from actual visitors for real-time insights.
- Combine Both: Synthetic testing is proactive, while RUM shows real-world user experiences. Together, they provide a full picture.
- Optimize Using Data: Analyze cache efficiency, latency, and regional performance to identify bottlenecks and improve speed.
Even small delays can cost millions in lost revenue. By consistently monitoring and fine-tuning your CDN, you can improve user satisfaction and reduce costs.
CDN Monitoring
sbb-itb-94eacf4
Setting Up CDN Monitoring
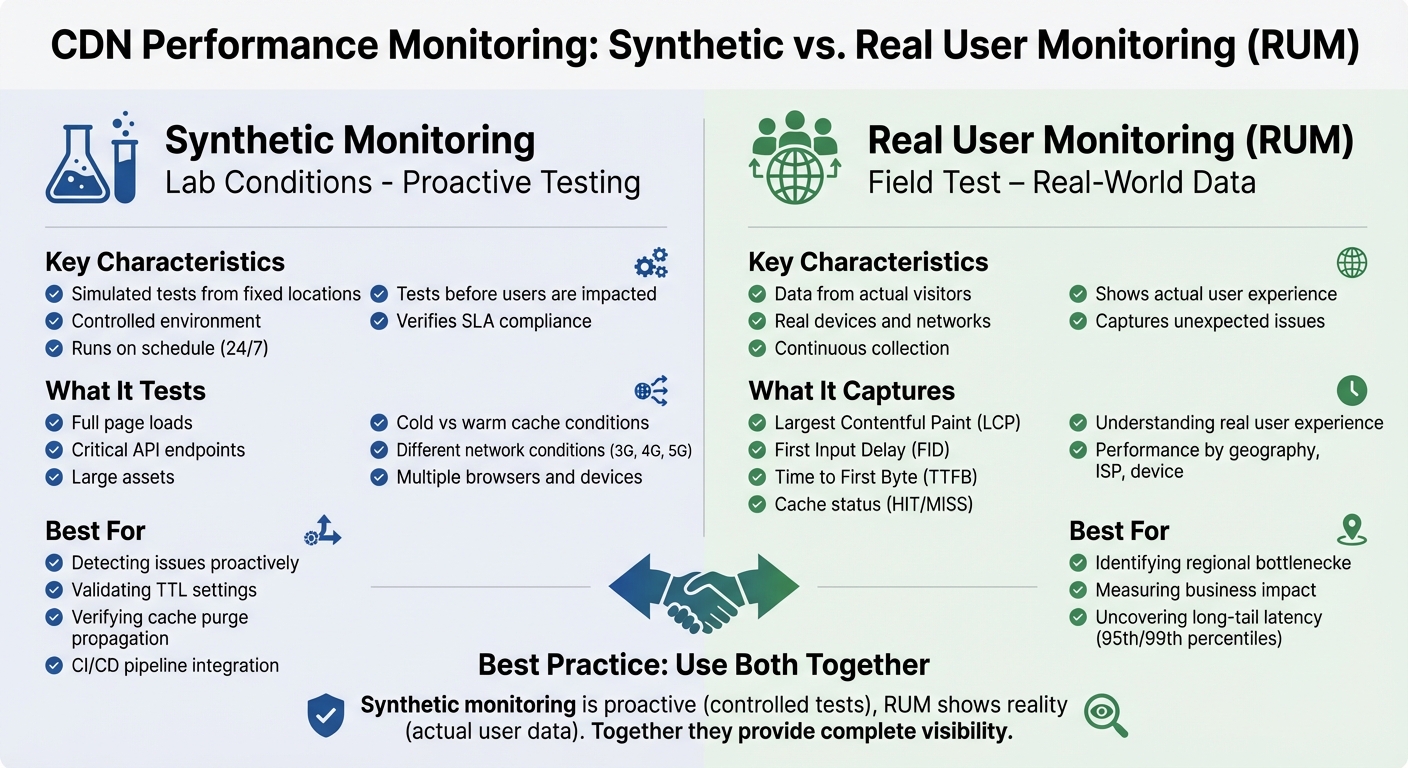
Synthetic Monitoring vs Real User Monitoring (RUM) for CDN Performance
Synthetic Monitoring for Testing
Synthetic monitoring involves running scripted tests from specific locations to evaluate CDN performance in a controlled environment. This approach helps identify potential issues before they affect users.
Deploy probes from various global locations to verify proper CDN mapping and use traceroute data to uncover routing problems. Dual-path testing is also key - compare requests routed through the CDN with direct origin server requests. Running these tests under both "cold" and "warm cache" conditions can reveal latency differences and validate TTL settings.
Focus on monitoring full page loads, critical API endpoints, and large assets. Simulate different network conditions, such as 3G, 4G, and 5G, while testing across multiple browsers and devices. Integrating these tests into your CI/CD pipeline helps catch performance regressions early.
While synthetic monitoring provides controlled insights, it’s only part of the picture. Real-user data is essential for understanding actual user experiences.
Real User Monitoring (RUM) for Visitor Data
Real User Monitoring collects data directly from visitors as they interact with your site. The process starts with adding a JavaScript snippet to your pages, either through a third-party service or a custom script using browser performance APIs. This snippet relies on standard APIs like PerformanceNavigationTiming, PerformanceResourceTiming, and PerformancePaintTiming to gather detailed timing data.
Tagging requests with custom headers or query parameters can help differentiate CDN configurations. Configure your monitoring tool to capture key details such as the CDN hostname and cache status (HIT/MISS) from response headers, which provides direct insights into CDN performance.
Segment the collected data by geography, ISP, device, and connection type to identify specific bottlenecks. Focus on metrics like Largest Contentful Paint (LCP), First Input Delay (FID), and Time to First Byte (TTFB) to evaluate the CDN's effect on user experience. Instead of relying on averages, prioritize the 95th and 99th percentiles to uncover outliers and long-tail latency issues.
Combining Both Monitoring Methods
To get a complete understanding of CDN performance, combine synthetic monitoring with real-user data. Each method provides a unique perspective: synthetic monitoring is proactive, running controlled tests from fixed locations to ensure SLAs are met before users are impacted. On the other hand, RUM captures how actual users experience your site, highlighting issues that synthetic tests might miss.
"If synthetic tests are like lab conditions, Real User Monitoring is the field test. It captures how real users, on real devices and networks, experience your application with the CDN in place." – BlazingCDN
By correlating synthetic probes, RUM data, and CDN edge logs, you can pinpoint the root causes of performance issues. For example, synthetic tests can compare "cold-cache" and "warm-cache" behavior, while RUM data shows how often users encounter cold-cache delays. Breaking down TTFB into connection time and server processing time can help identify whether delays stem from network issues, origin servers, or CDN edges.
Synthetic monitoring is also useful for verifying that cache purges or content updates have propagated across all CDN points of presence. Meanwhile, RUM metrics like LCP and FID can be linked to business KPIs, such as conversion rates and session duration, to measure the CDN's impact on overall user satisfaction.
Analyzing CDN Performance Data
Cache Efficiency and Behavior
Once you've set up monitoring, diving into cache metrics can reveal how well your CDN is performing. One key metric to focus on is the Cache Hit Ratio (CHR). This is calculated by dividing the number of cache hits by the total number of requests. A high CHR means most content is served directly from the edge, leading to quicker page loads and less strain on your origin server . For static files like images, CSS, and JavaScript, aim for a hit ratio between 95% and 99%.
Another important metric is the Byte Hit Ratio (BHR), which measures the percentage of total bytes delivered from the cache instead of the origin. This metric can have a direct impact on hosting costs, especially if your provider charges for origin egress traffic. A high request hit ratio doesn’t always mean you're in the clear - a low BHR might indicate that larger files are bypassing the cache, which can drive up bandwidth costs.
Analyzing cache status codes is another quick way to spot inefficiencies. Segmenting data by asset type can help identify resources overloading the origin server . For example, while static assets often hit the 98% range, API responses may fall short of the recommended 70–95%, signaling a potential misconfiguration. To avoid unnecessary cache misses, normalize URLs by removing extra query strings from static objects . Also, configure your CDN to ignore cookies for static assets, as cookies can make files uncacheable.
| Metric | Primary Focus | Business Impact |
|---|---|---|
| Cache Hit Ratio (CHR) | Performance & Latency | User Engagement & Conversions |
| Byte Hit Ratio (BHR) | Bandwidth & Egress | Infrastructure Cost Reduction |
| Origin Offload | Server Capacity | Reduced Origin Compute Costs |
Once you've reviewed cache metrics, the next step is to dig into request timing to uncover latency bottlenecks.
Request Timing and Latency Analysis
Browser developer tools can generate HAR (HTTP Archive) files, which capture every request, response, and delay . These files are invaluable for breaking down total latency into phases like DNS lookup, TCP handshake, SSL/TLS handshake, Time to First Byte (TTFB), and content download .
If DNS lookup times exceed 50 ms, it could point to problems with your DNS provider or insufficient caching. Similarly, high connection or SSL/TLS handshake times might indicate too many new connections or the use of outdated protocols like TLS 1.2 instead of TLS 1.3. A high TTFB often signals cache misses, slow origin servers, or backend inefficiencies . For static assets served from cache, aim for a global TTFB under 100 ms in key regions.
Correlate timing data with cache status from edge logs or response headers. Cache MISS events naturally result in higher TTFB due to fetching content from the origin . Upgrading to modern protocols like HTTP/2 or HTTP/3 can help by allowing multiple requests to share a single connection, reducing overhead. Using resource hints like dns-prefetch and preconnect can also pre-warm connections, improving load times.
Audit third-party scripts using HAR files to identify slow-loading elements like ads or trackers. Loading these resources asynchronously can prevent them from blocking the critical rendering path . Well-optimized sites typically complete 70–90% of requests in under 500 ms, with fewer than 5% of requests taking over 1,000 ms.
Timing data like this makes it easier to identify performance issues by region.
Regional Performance Differences
Global averages don’t tell the full story when it comes to CDN performance. Segmenting data by region can uncover specific areas where latency is unusually high. For example, even within the same city, performance can vary between ISPs like Jio and Airtel in India. Tracking performance at the ISP level can reveal whether issues stem from a particular network provider or the CDN's points of presence.
Breaking down TTFB by region helps pinpoint whether delays come from DNS resolution, TCP connection times, or backend processing. Synthetic monitoring and RUM data, as discussed earlier, can show whether latency issues are widespread or isolated to a specific point of presence . For instance, if users in Southeast Asia experience a TTFB of 400 ms while North American users see 80 ms, this gap might call for adjustments to your CDN configuration or the addition of more edge locations.
You can also compare performance across device types and connection speeds in each region. Mobile users on slower networks, like 3G in rural areas, will have a different experience than desktop users on high-speed fiber in urban centers. These insights can guide a CDN strategy tailored to the actual conditions your users face.
Optimizing CDN Performance
Use your data insights to establish precise performance alerts and quickly address any issues that arise.
Setting Up Alerts and Performance Baselines
To create effective alerts, start by building detailed baselines that reflect how your CDN performs across various regions, ISPs, and content types. A single global average won’t give you meaningful insights. Instead, set separate thresholds for static assets versus dynamic content, and tailor them to specific regions like North America or Southeast Asia. Focus on the 95th and 99th percentiles to uncover tail latency, as global averages often mask these details.
For Cache Hit Ratio (CHR), configure alerts to trigger if the ratio drops below 85% overall or 95% for static assets. When it comes to Time to First Byte (TTFB), aim for a median under 800 ms in key markets, and ensure the 95th percentile stays below 1,800 ms. Multi-condition alerts can help cut down on unnecessary notifications - set them to trigger only when multiple metrics, like a CHR drop combined with a spike in origin latency, occur simultaneously. This approach reduces alert fatigue and ensures your team focuses on actual issues.
"Availability isn't just binary - track partial outages, retry rates, and regional blips for true user experience." – BlazingCDN
Establish internal Service Level Objectives (SLOs) that are stricter than your vendor’s SLA. This gives you a buffer to catch potential problems before they escalate into SLA breaches.
Once your baselines are in place, you’ll be better equipped to troubleshoot and resolve performance issues.
Troubleshooting and Root Cause Analysis
When performance problems arise, break down TTFB into two components: "connect time" (network and peering delays) and "server time" (CDN compute or origin response). This helps identify whether the issue lies with the network or the backend. If connect time is unusually high in a specific region, use traceroute to check whether users are being routed to the nearest edge server or if DNS misconfigurations are sending them to distant locations.
A sudden drop in CHR should prompt an audit of your Cache-Control headers, cache key configurations (like unnecessary Vary headers), and TTL settings. Small misconfigurations can fragment your cache, causing unnecessary origin fetches. Similarly, if high latency appears in a particular region or ISP, it may point to suboptimal peering or issues at a specific edge server. Segmenting Real User Monitoring (RUM) data by region and ISP can help pinpoint these anomalies.
Keep an eye on purge propagation to avoid regional content mismatches. Use custom headers to tag experimental traffic, allowing you to compare RUM data before and after changes.
After addressing internal issues, cross-check your results against vendor benchmarks.
Verifying CDN Vendor Claims
Use synthetic monitoring tools from independent third-party sources to measure baseline latency and availability. These tests can help confirm whether your vendor’s performance matches their advertised benchmarks and SLA commitments. To go further, run A/B or canary tests by splitting traffic between providers. Compare metrics like the 95th and 99th percentiles of Largest Contentful Paint (LCP) and TTFB to see which vendor delivers better results in your priority markets.
You can also verify "origin offload" claims by analyzing origin egress costs and request counts before and after CDN implementation. For example, Netflix found that a 1% improvement in CHR saved them petabytes of origin traffic annually, significantly cutting infrastructure costs. Your data should show similar patterns if your CDN is performing as expected. If the vendor’s claims don’t align with your monitoring data, you’ll have the evidence needed to renegotiate terms or explore other options.
Conclusion
CDN performance is not a "set it and forget it" task - it requires constant attention. Even minor delays can lead to noticeable drops in user engagement and revenue.
The best way to stay ahead is through a multi-layered monitoring strategy that combines synthetic tests, real-user data, and log analytics. This approach makes it easier to identify regional performance issues and highlights the importance of analyzing the 95th and 99th percentiles instead of relying on averages. These higher percentiles expose the "long tail" of slower user experiences, which averages often fail to reveal.
"The organizations that win on digital experience treat CDN performance as a living system to be observed, tuned, and optimized, not as an invisible checkbox." – BlazingCDN
Optimization is an ongoing, data-driven process. Start by monitoring your metrics, identify pain points like low cache hit ratios or high regional TTFB, tweak your configurations, and validate improvements using both RUM and synthetic tests. For example, achieving a cache hit ratio of 95% or more can cut median response times by up to 75% and reduce backend load costs by as much as 85%. Regularly diving into your data ensures that your CDN remains an asset, not a hidden performance bottleneck.
Ultimately, the difference between a good digital experience and an exceptional one lies in the fine details buried in your CDN metrics. These insights can predict everything from viral growth to costly outages. By applying the strategies discussed here, you'll be well-positioned to keep your website fast, dependable, and conversion-ready.
FAQs
Which CDN metrics matter most for my site?
When managing a CDN, keeping an eye on the right metrics is crucial to ensure smooth and efficient performance. Here are the key ones to focus on:
- Cache hit ratio: This measures how often content is served directly from the CDN's cache rather than the origin server. Aim for a high percentage - ideally between 85% and 95% - to ensure fast delivery and reduced server load.
- Latency: Metrics like Time to First Byte (TTFB) reveal how quickly your CDN responds to user requests. Lower latency means a better experience for your users.
- Error rates: These indicate any issues with content delivery or server errors. Keeping error rates low is critical for maintaining reliability.
- Throughput: This measures the amount of data transferred over time, giving insights into how well your CDN handles traffic.
- Origin fetch rates: High origin fetch rates can signal inefficiencies, as they show how often the CDN has to retrieve content from the origin server. Reducing these rates can cut costs and improve load times.
By tracking these metrics, you can fine-tune your CDN's performance, manage costs effectively, and deliver a smoother experience for users.
How do I set up RUM without slowing pages down?
To implement Real User Monitoring (RUM) without slowing down your page, use a lightweight script and add the defer attribute. Place the script just before the closing </head> tag. For even quicker delivery, you can either use a Content Delivery Network (CDN) or self-host the script to avoid delays caused by network latency. These steps help you integrate RUM effectively while keeping page load times fast.
What alert thresholds should I start with?
Start by setting thresholds that match your existing performance metrics and service level objectives. For instance, keep an eye on error rates like 5xx errors or aim for cache hit ratios in the 85–95% range. To fine-tune these, take a week to analyze typical response times or error rates, then include a 20–30% buffer to account for fluctuations. Make sure to adjust these thresholds as needed, considering variability and the overall user experience, so they align with actual conditions.